
Running on Borrowed Time: Is Your Marathon Pace Sustainable?
four runners chasing a 3:30 marathon time. The data reveals why the "fittest" athlete is the least likely to cross the finish line.
Why the fittest won’t necessarily have the Best Marathon time.
If you stood at the start line of a marathon and compared these four runners based purely on their physiological stats, who would you bet on?
Runner A: VO2 Max of 48 ml O2/kg/min
Runner B: VO2 max of 58 ml O2/kg/min
Runner C: VO2 max of 65 ml O2/kg/min
Runner D: VO2 Max of 68 ml O2/kg/min
Conventional wisdom says Runner D wins by a mile with VO2 max setting the ceiling of the aerobic system. Despite this, the "bigger engine." doesn’t always correlate to the fastest times. We need to look deeper to understand what determines performance. The Marathon doesn't care how big your engine is; it cares how efficient you are at converting the oxygen into speed.
In our recent case study of athletes targeting a 3:30 marathon (5:00/km pace), the data suggests that Runner D despite being the "fittest" is actually the most likely to DNF if they attempt to maintain the pace based on their current fitness.

Part 1: The VO2 Max Defense (Why You Still Need a Big Engine)
After seeing the data on Runner D, you might be tempted to think, "Okay, VO2 Max is overrated. I’ll just focus on efficiency."
That would be a mistake.
While efficiency decides how much fuel you burn, VO2 Max determines the size of the engine and why it remains one of the most critical metrics we measure at Total Endurance, not just for your marathon time, but for your future.
Here is why we still obsession over building a bigger engine:
1. Performance: The "Ceiling" Effect
Think of VO2 Max as the height of the ceiling in your house.
If your ceiling is low (Low VO2 Max), you are constantly crouching. Even a jog feels cramped and hard.
If your ceiling is high (High VO2 Max), you have room to stand tall.
Look below at Runner A in our data. They are incredibly efficient. But because their engine is small (VO2 Max 48), running at 5:00/km requires them to work at 73% of their maximum capacity. They have a narrow range in which they can run (think cramped) . If Runner A improved their VO2 Max from 48 to 55, that same 5:00/km pace would drop from a strenuous 73% effort to a comfortable 64% effort.
A bigger engine makes hard work feel easy. This is something we often see with competitive swimmers where they have an incredibly strong engine and they can usually take in a lot of oxygen but their body is not very efficient in using the large volume of oxygen they take in, and why, it's often hard for them to run ‘slow’. The pace doesn’t feel challenging but they usually don’t have the strength (especially in the tendons) to convert the oxygen into sustained running speed and tend to suffer from regular injury.
If you're a swimmer and looking to progress into triathlon and if your V02 max is already well established, focusing on the bike to build your strength can be more beneficial and work on running technique and get stronger before trying to increase your running speed. We’ll write a blog focused on this in the future.
2. Longevity: The Ultimate Health Metric
Beyond the race course, VO2 Max is arguably the single most important number for your long-term health. It is the strongest predictor of "all-cause mortality"
The Engine of Youth: VO2 Max naturally declines by about 10% per decade after age 30. If you start with a "average" engine, you will run into functional limitations in your 60s and 70s. You might struggle to climb stairs or play with grandchildren.
The "Reserve" Tank: Building a high VO2 Max now creates a physiological "reserve." It ensures that when you are 80, you still have enough engine power to hike, travel, and live independently.

Part 2: The Cost of Speed (Understanding Running Economy)
To understand why the "fittest" runner might fail, we have to stop looking at their maximum potential and start looking at the actual cost of running at race pace (5:00/km).
Let’s break down the physiology of our runners at this exact speed:
Step 1: The Oxygen Cost (The Demand)
First, we measure simply how much oxygen each runner needs to inhale every minute just to maintain 5:00/km.
Runner A: Requires 35 ml of oxygen/kg/min.
Runner B: Requires 38 ml of oxygen/kg/min
Runner C: Requires 45 ml of oxygen/kg/min
Runner D: Requires 52 ml of oxygen/kg/min.
From this data we see there’s a big difference in the amount of oxygen each runner needs to run at the exact same speed, Runner D needs to process 50% more oxygen than Runner A. Their body is working drastically harder to produce the same output.
Step 2: The Relative Intensity (The Stress)
Next, we compare that demand to their engine size (VO2 Max). We calculate the percentage of their VO2 max, this is the intensity to run that pace.
Runner D: Their engine is huge (VO2 Max 68), but because their cost is so high (52 ml), they are forced to run at 76% of their maximum capacity.
Runner B: Their engine is smaller (VO2 Max 58), but their cost is lower (38 ml). This puts them at a comfortable 65% intensity.
Runner A = 73% and Runner C = 69%
From this data we start to see who starts to show the most likely to achieve the 3:30 target time and who is likely to end up disappointed on race day.
Step 3: What is Running Economy?
This brings us to the hidden metric that explains the difference: Running Economy.
Running Economy is your "Miles Per Gallon." It measures the energy cost to move your body over a specific distance (one kilometer). We measure this as ml of Oxygen per kg of body weight per km (ml O2/kg/km)

Runner A: Economy score of 175 ml O2/kg/km. This is "Very Good." They waste almost no energy.
Runner B: Good running economy at 190 ml O2/kg/km
Runner C: They have average running economy of 225ml O2/kg/km
Runner D has the highest (less efficient) running economy at 260 ml O2/kg/km. This is below average and indicates they are leaking energy with every step—likely due to poor form, extra vertical oscillation (bouncing), or lack of stiffness in their tendons.
Part 3: The 70% Rule (The Ceiling of Sustainability)
Now that we know the cost of running, we have to ask the most important question in endurance racing: Is that cost sustainable for 3.5 hours?
To answer this, we look at the "Marathon Intensity Ceiling." Note: This will vary based on duration of event (longer time = lower intensity)
Physiologically, the human body has a "speed limit" for long-duration events. For a marathon (running 3+ hours), that limit is generally around 70% of your VO2 Max.
Below 70% (The Safe Zone): You are primarily burning fat for fuel. Lactate levels are stable. You can hold this effort for a long time without fading.
Above 70% (The Danger Zone): You shift towards burning precious glycogen (sugar). Metabolic byproducts start to accumulate. You are on a countdown timer to fatigue.
The Sustainability Graph: Who Crashes?
We plotted our four runners on a graph to visualize their "Safe Zone" vs. their "Actual Reality."
The White Horizontal Lines: These represent each runner's specific 70% ceiling. To be safe, they must stay below their line.
The Red X's: This marks the actual oxygen demand we measured at their 5:00/km race pace.
Let's see where they land:
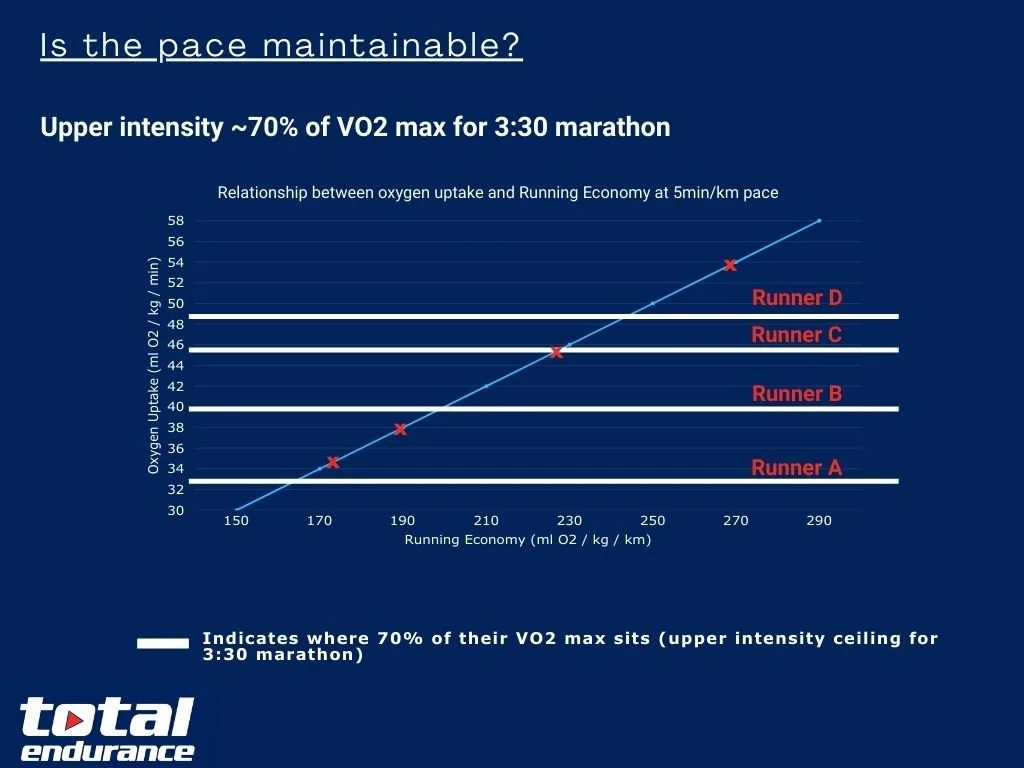
Runner D: Look at the top right of the graph. Their ceiling (white line) is high because they are fit, but their cost (Red X) is way above the line. They are running at 76% intensity. They are working significantly harder to maintain the pace
Runner A: Look at the bottom left. Even though they are efficient, their ceiling is very low. Their Red X is floating slightly above their white line (73% intensity). They are redlining just to hold on.
Runner C: Their Red X is sitting dead on the line (~69%). They have zero margin for error. A hill or headwind pushes them into the red.
Runner B: This is what you want to see. Look at the gap between their Red X and their white line. They are running at 65% intensity, safely under their 70% ceiling.
Part 4: Fuelling the marathon
So we now know is physiologically capable of achieving the 3:30 and who isn’t. What about fueling which can also derail even the most efficient runner.
The harder you run relative to your VO2 Max, the more your body relies on carbohydrates (glycogen) instead of fat. This is critical because your body has a limited fuel tank—roughly 400g to 500g of stored glycogen. Once that tank hits critical lows (around 200g remaining), your brain forces you to slow down to preserve sugar for vital organs. This is "Bonking"
We measured exactly how many grams of carbohydrates each runner burns per hour at their 3:30 marathon pace. The results are the final nail in the coffin for the "fitness" argument.
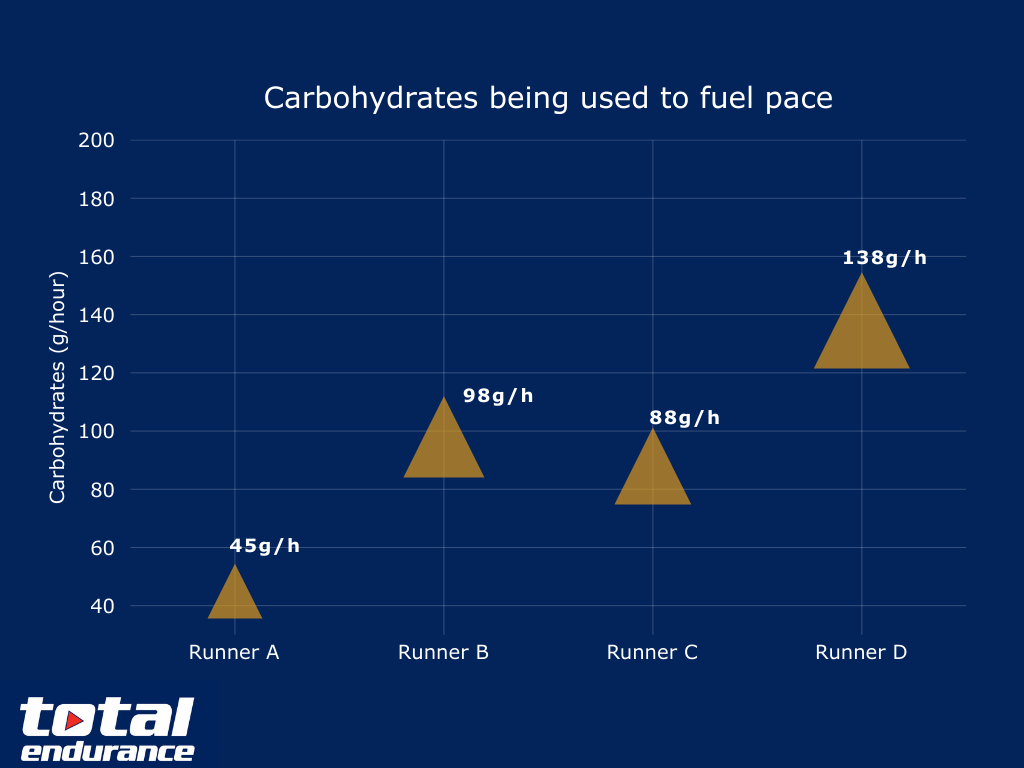
Despite being the fittest on paper, Runner D is running at 76% intensity. This high intensity forces their body to burn fuel at an astronomical rate burning through 138g of carbs per hour.
Runner A is efficient, so their fuel cost is incredibly low burning a modest 45g per hour.
Runner B and Runner C are burning a similar amount of carbs 98g and 88g respectively.
Part 5: Can you make it to the finish without bonking?
A common rule of thumb in the marathon world is to consume 60g of carbohydrates per hour (roughly 3 standard energy gels). For many runners, this is good advice. But based on our data, applying this generic rule to our specific runners leads to wildly different outcomes.
We started each runner with a standard fuel tank of 400g of stored glycogen (the starting point on our graph). The danger zone—"The Wall"—is the red line at 200g.
Let’s see what happens if they all follow the exact same 60g/hour fueling strategy for their 3.5-hour race:
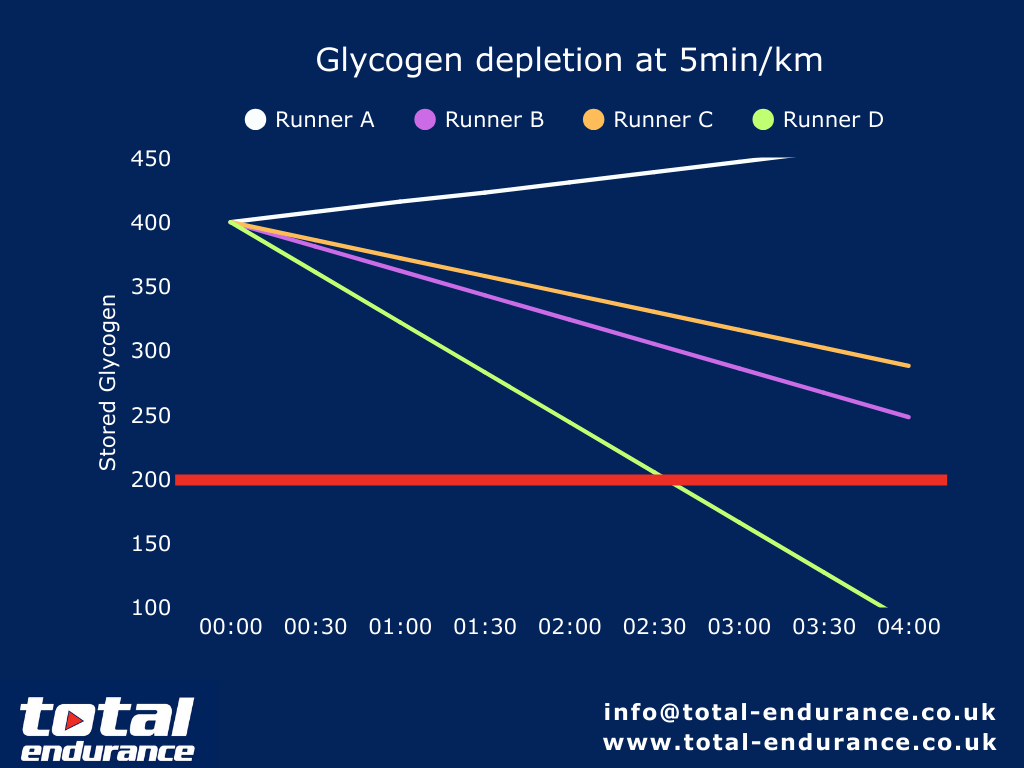
Note: It’s important to recognise that fuel usage and nutrient absorption vary between individuals and can be affected by fitness level, environmental conditions, and training history. This graph offer guidance, not precise predictions.
Runner A:
Burn Rate: 45g/hr.
Intake: 60g/hr.
The Math: They are taking in more than they burn (+15g/hr).
The Result: Their glycogen stores actually increase (or stay topped off) throughout the race, matching the white trajectory on our graph. They finish with a full tank. For them, 3 gels an hour is actually overkill and might just cause an upset stomach.
Runner B & C:
Burn Rate: 88-98g/hr.
Intake: 60g/hr.
The Math: The are running at a deficit of -28-38g/hr.
The Result: Over 3.5 hours, they lose roughly 133g of stored fuel.
Start: 400g.
Finish: 267g.
They finish comfortably above the 200g red line. The standard strategy works perfectly for them.
Runner D:
Burn Rate: 138g/hr.
Intake: 60g/hr.
The Math: Even with aggressive fueling, they are running a massive deficit of -78g/hr.
The Result:
At this rate of loss, they will drop below the 200g red line around the 2 hour 30 minute mark.
Despite eating 3 gels an hour, they still hit the wall an hour before the finish line. However, if they are able to nudge the fuel towards 90g/h they could theoretically avoid bonking.
The Final Result: Who Cracks 3:30?
We’ve looked at the engine (VO2 Max), the mileage (Running Economy), and the fuel tank (Glycogen). So, if the race was held tomorrow, who is crossing the finish line in 3 hours and 30 minutes?
The Likely Winner: Runner B
Runner B is the only athlete currently in the physiological "Sweet Spot."
The Data: Their intensity is a sustainable 65%, and they have plenty of "headroom"
The Outcome: They will likely run an even split, handle the late-race fatigue, and finish strong. Potential to run faster.
Runner C - Possible but needs caution
Runner C is walking a tightrope.
The Data: They are running at 69% intensity.
The Outcome: This is dangerously close to the 70% "danger zone". On a perfect day, they finish. But if it's hot, windy, or they go out too fast, they will likely fade in the final 10k.
Runner A - It is possible but risky
Runner A is the classic "I gave it everything I had" but it of been enough
The Data: Efficient but underpowered. They are forcing their body to hold 73% intensity for hours.
The Outcome: They won't run out of fuel, but their neuromuscular system will likely fail. Expect a slow, painful fade starting at 30km. Commonly with this type of runner, their last few long runs get tough and their legs feel very heavy.
Runner d: Very unlikely
Runner D is the tragedy of wasted potential.
The Data: They are burning 138g of carbs/hour and sitting at 76% intensity.
The Outcome: Mathematics guarantees a failure here. They deplete their glycogen stores by the 2:15 mark. This isn't a "fade"; it's a catastrophic bonk. They likely walk off the course.
The Roadmap: How We Fix Them (With 12 Weeks Prep)
The beauty of physiology is that it isn't fixed. They each have things they can work on improving to achieve the 3:30 or even faster.
1. The Plan for Runner A: "Build the Engine"
The Problem: Their ceiling is too low (VO2 Max 48). 5:00/km takes too much relative effort.
The Fix: High-Intensity Interval Training (HIIT).
Focus: Lift their aerobic ceiling with specific VO2 max work. they can afford to lose some efficiency to gain speed.
Goal: Raise their VO2 Max from 48 to 55. If they can achieve this, we should see them start to challenge 3:15-3:20 and possibly even faster.
2. The Plan for Runner B: "Test a faster pace"
The Problem: They are already capable of achieving a faster marathon time so training should be focused on dialing in 3:15-3:20 pace, but also test if they can raise their ceiling and potential to trend towards 3 hours.
The Fix: Durability & Specificity.
Focus: Long tempo runs at race pace and high-volume aerobic weeks.
Goal: Don't try to change their physiology (it's already good). Focus on muscular endurance so their legs don't give out before their lungs do.
2. The Plan for Runner C: "Improve the economy"
The Problem: They have a suitably strong engine but could benefit from being more economical.
The Fix: Strength & Mechanics.
Focus 1 (Gym): Heavy resistance training and plyometrics (hopping/jumping) to improve tendon stiffness. A "stiffer" runner bounces for free; a "soft" runner pays for every step.
Focus 2 (Form): Gait retraining to reduce vertical oscillation (bouncing up and down) and braking forces.
Goal: Improve economy from 260 to 220. This would instantly drop their carb burn rate from an impossible 138g/h to a manageable level.
3. The Plan for Runner D: "Efficeincy and rebound"
The Problem: They are leaking energy. A 260 economy score means bad mechanics.
The Fix: Strength & Mechanics.
Focus 1 (Gym): Heavy resistance training and plyometrics (hopping/jumping) to improve tendon stiffness. A "stiffer" runner bounces for free; a "soft" runner pays for every step.
Focus 2 (Form): Gait retraining to reduce vertical oscillation (bouncing up and down) and braking forces.
Goal: Improve economy from 260 to 220. This would instantly drop their carb burn rate from an impossible 138g/h to a manageable level.
Focus 3 (Volume): Build longer aerobic volume (likely need to slow down initially)
Goal: Improving their running economy (reducing oxygen needed to maintain pace) they have the biggest potential to become a significantly faster runner. If they can improve Running economy by 15% then they should be capable of running under 3 hours.
Summary: Don't Train Blind
This case study proves one thing: There is no such thing as a generic training plan. Your current physiology dictates where training should focus to ensure you arrive on the start line prepared to achieve your goals.
If Runner D followed Runner A’s plan (VO2 Max intervals), they would just get fitter at running inefficiently. If Runner A followed Runner D’s plan (Technique work), they would become a beautiful runner who is still too slow.
All the data shown above is included in our Endurance Running Assessment and we aim to give you a clear understanding of your current physiology and guide you towards the exact training needed to improve.