
We Didn't Get Mark's Marathon Training Right. This Is Why.
We're experienced coaches. We understand physiology, we understand training principles, and we've built some genuinely successful race outcomes for the athletes we work with.
And we still got Mark's London Marathon preparation wrong.
Not recklessly. Not through a lack of effort or care. We just didn't read the data deeply enough to see what it was actually telling us. Since then, we've spent considerable time going back through Mark's full metabolic profile - understanding how the numbers interact, what the raw lactate behaviour reveals beyond the headline metrics, and what it all means for how he should train and race. This is that story.
The February test — what we saw
In February 2026, Mark completed a full lactate and metabolic test. We used INSCYD to model his physiology and came back with the headline numbers.
When we reviewed those numbers, the logical conclusion seemed clear: VO2max of 44.76 is solid but not elite. VLamax at 0.43 is slightly elevated for a marathon runner - ideally you'd want lower than 0.35. The threshold sitting at 77.7% of VO2max is on the lower side. The limiter looks like aerobic ceiling. We should build VO2max work into the plan.
So we did. VO2max intervals, structured intensity. Standard coaching logic: if the ceiling is the problem, raise the ceiling.
The data was telling us something different. We just weren't reading it carefully enough.
The metrics pointed to VO2max as the limiter. The full profile was pointing somewhere else entirely - at the aerobic foundation those metrics were sitting on.
What the lactate curve was actually saying
Here is where we should have spent more time. Not at the threshold — but at the early submaximal stages, where the real story about an athlete's aerobic base quality lives.
| Pace | Lactate | % of MLSS | What it means |
|---|---|---|---|
| 6:40/km — easy jog | 2.2 mmol/l | 79% | Already burning carb heavily at warm-up pace |
| 5:27/km — moderate | 2.6 mmol/l | 92% | Near-threshold — not genuine aerobic work |
| 4:37/km — threshold | 3.6 mmol/l | 100% | Confirmed MLSS |
| 3:45/km — all-out | 7.7 mmol/l | 133% | Peak lactate |
That first number is the one that should have stopped us. At 6:40 per kilometre — a pace most runners use for recovery or warm-up — Mark's lactate was already 2.2 mmol/l. A well-trained endurance runner at that pace would typically show 1.0–1.4 mmol/l. Mark was nearly double that.
His FatMax sitting at 11:58/km confirmed the picture. At any pace he would actually train or race at, fat contribution to fuelling is minimal. His aerobic fat-burning window is extremely narrow — and his VLamax of 0.43 is the driver. A higher glycolytic rate suppresses fat oxidation. The body keeps burning glycogen even when slower, more aerobic work would be the smarter metabolic choice.
The training we did vs. the training he needed
This is the uncomfortable coaching truth at the centre of this story.
We prescribed VO2max work because we read the ceiling as the limiter. But you cannot build a strong ceiling on a weak foundation. Mark's real limiter wasn't his aerobic ceiling - it was the aerobic base: the fat oxidation capacity, the mitochondrial density, the metabolic flexibility at submaximal intensities that determines how long he can sustain effort without depleting glycogen stores.
Every week of high-intensity training we prescribed was building on that weak foundation. We were training a carbohydrate-dependent system to work harder, not training it to become less carbohydrate-dependent in the first place.
The VO2max work wasn't wrong. It was premature. What the full profile was telling us Mark needed was a sustained block of genuinely low-intensity aerobic volume - foundation before ceiling.
There's a second issue that makes this more significant. Mark's easy runs weren't actually easy. A session logged shortly before London showed him averaging 5:33/km at 127 bpm - which looks reasonable on a training log. But cross-referenced with his February lactate data, that pace was sitting at approximately 2.3–2.5 mmol/l. That's not easy. That's the grey zone between aerobic and threshold: hard enough to accumulate lactate, not hard enough to be productive threshold work, and completely bypassing the fat oxidation stimulus we needed to build.
Every "recovery" run was quietly reinforcing the problem. Without genuine low-intensity work, his fat oxidation system never received the training stimulus it needed to improve.
The race — what the data shows
This is where it gets precise. We have two things: the output of our fuelling calculator, run with Mark's metabolic data at marathon pace; and his actual GPS race file from London. The correlation between what the calculator predicted and what the data shows is almost exact.
The fuelling calculator predicted the glycogen danger zone at km 25.3. The GPS race file shows the pace breaking down at km 25. The prediction and the reality are within 0.3km of each other.
The calculator predicted glycogen danger at km 25.3. The GPS data confirms pace deterioration from km 25 and full collapse from km 31 — exactly where the maths said it would happen.
The tool we built because of this
One of the things that came out of Mark's race — and our honest reflection on what we missed — was that we needed a better way to model the consequences of an athlete's metabolic profile before race day, not after it.
So we built one.
Our fuelling calculator takes the raw data from an athlete's lactate test and models exactly what happens to glycogen stores at different paces and carbohydrate intake strategies. It's something we've only recently developed, and Mark's marathon is a big part of why it exists.
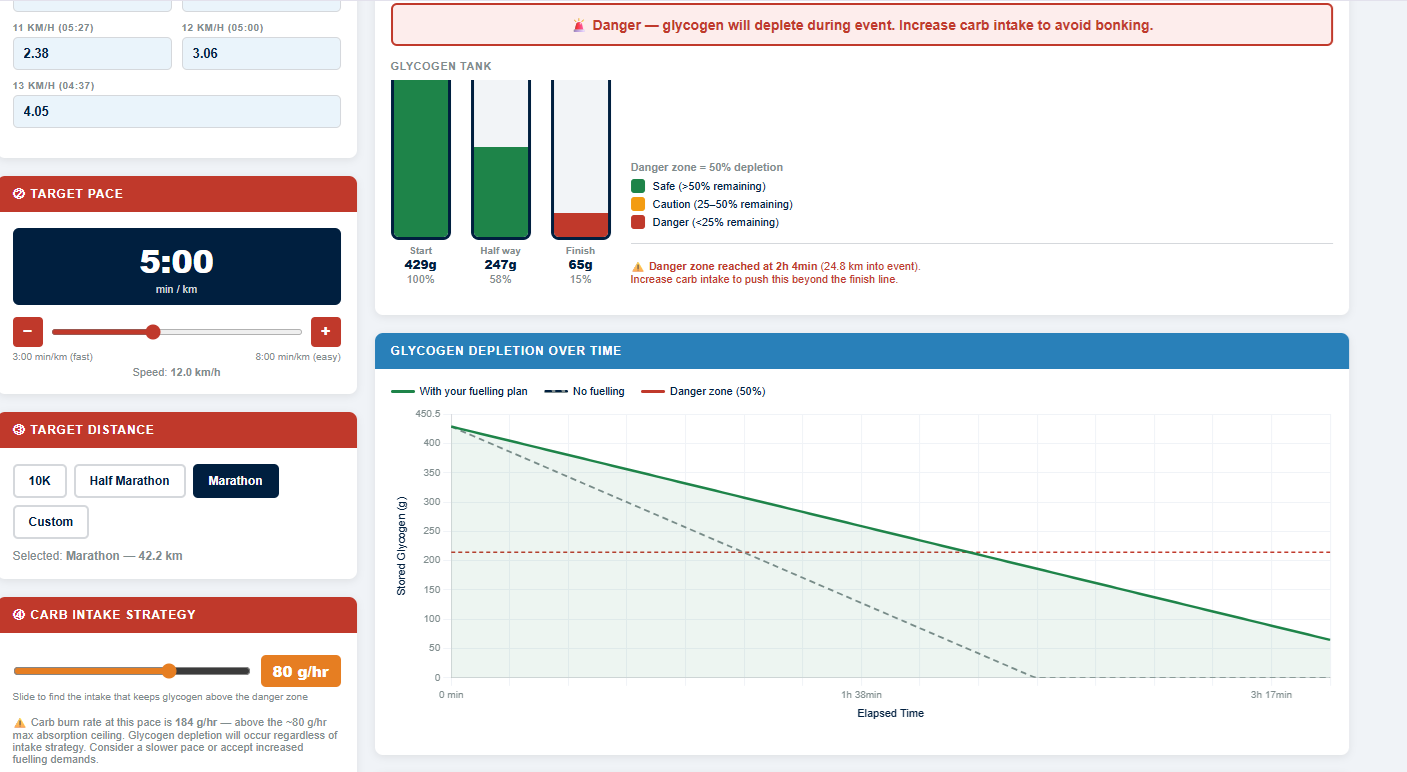
When we ran his numbers through it at 5:00/km marathon pace, the output was immediate and unambiguous. His carbohydrate burn rate at that pace is 184g per hour. The maximum the gut can absorb is around 80g per hour. The calculator flags this directly — glycogen depletion will occur regardless of intake strategy.
The glycogen tank shows it visually. Starting at 429g, even with maximum fuelling, stores drop into the danger zone at 2 hours 4 minutes — just 24.8km into the race. We now run every athlete through this before we build a race plan. It takes the guesswork out of fuelling strategy and makes the physiology impossible to ignore.
If we'd had this in February, we'd have seen the problem before the start line and adjusted race day expectations and focused on what he actually needed.
This is the calculator we built in the months after London. It takes an athlete's lactate test data and models glycogen depletion at any target pace and carbohydrate intake. For Mark at marathon pace, the danger zone is reached at 24.8km regardless of how well he fuels. The pace itself is the problem — not the nutrition strategy.
The fuelling calculator predicted the glycogen danger zone at km 25.3. The GPS race file shows pace breaking down at km 25 — within 0.3km of the prediction. This was not bad luck. It was the inevitable consequence of his metabolic profile at that pace.
What we're learning — and still learning
Here's the honest part: this isn't a story with a clean ending. We're still in the process of getting better at this.
Since February, we've been spending considerably more time with lactate data - not just identifying threshold and setting zones, but understanding what the stage-by-stage response reveals about each athlete's individual metabolic profile. And what we're discovering is that the variation between athletes is enormous. Two athletes can share almost identical VO2max and VLamax values and have completely different lactate curves, completely different substrate-use profiles, and completely different training needs.
The metrics are the starting point. The full profile is where the real information lives.
Going slower to go faster
The most counterintuitive coaching conversation we've had with Mark since this analysis is about pace. His easy runs need to get slower — significantly slower than feels right — before anything else can meaningfully change.
At paces that keep his lactate genuinely below 1.8 mmol/l — probably around 6:30–7:00/km initially - his fat oxidation system receives a real training stimulus for the first time. Mitochondria adapt. Fat oxidation capacity improves. VLamax comes down as a secondary consequence. His aerobic window widens. Carbohydrate dependency at marathon pace reduces. Glycogen stores last longer in races.
That process takes time - six to twelve months of consistent, genuinely easy volume, with pacing validated against lactate data rather than feel or heart rate alone. It's not dramatic. It doesn't generate impressive training peaks numbers. But it addresses the actual limiter, which is something we weren't doing before.
Mark has the capacity to go faster. His aerobic foundation hasn't been developed enough to support it yet. We go slow first. That's not a step backward — it's a strategy built on what the data actually says.
There's a philosophy that's guided how I've coached from the start: never assume that what you knew yesterday is the best or only approach. Always try to get better. Always keep learning. Mark's marathon is what that looks like in practice - not a failure, but a step in getting it more right next time.
Kevin